Lessons 16 : Data Science Workflow#
This lesson was developed with assistance from GPT-4-1106-preview, claude-2.1, and GPT-3.5-turbo.
![]()
Overview#
Data science workflow is the process to gain knowledge and insights from data. By the end of this lesson, you will be able to:
describe different steps in data science workflow
collect and preprocess data for analysis
1. Data science#
Data science employs techniques and theories from statistics, computer science, domain knowledge, and other areas to analyze and interpret complex data sets.
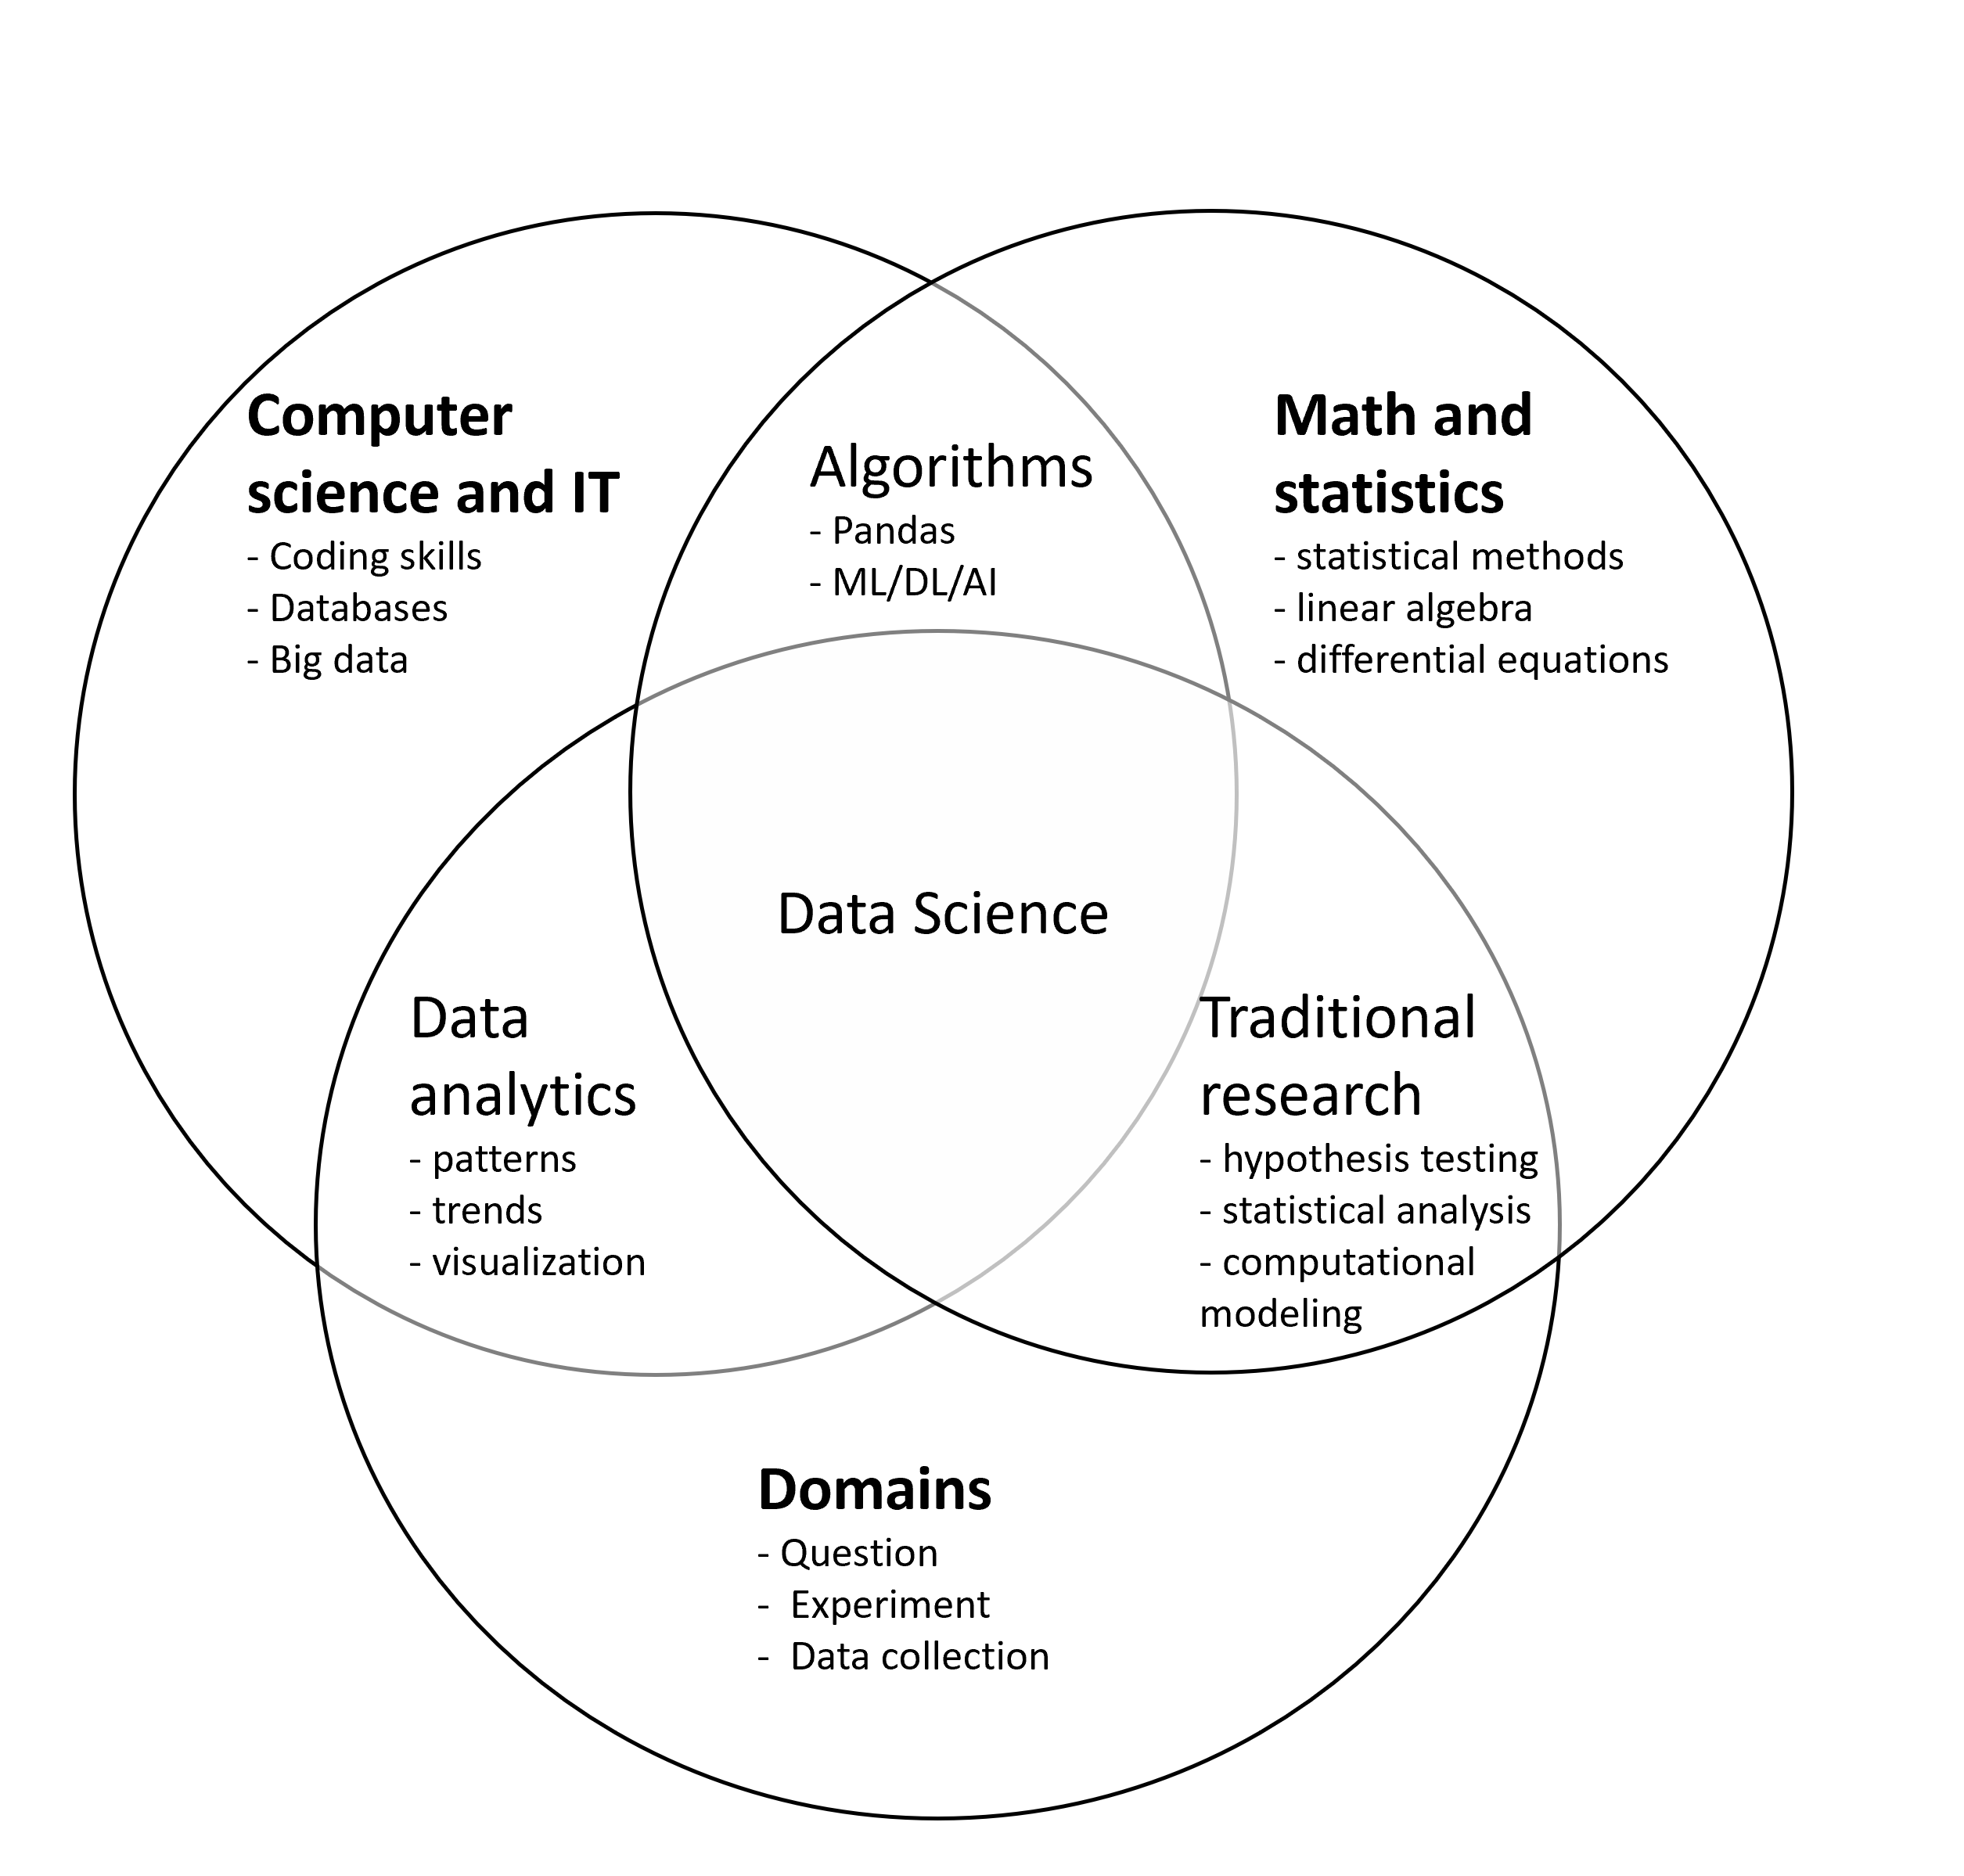
Data science is a multidisciplinary field that uses
scientific methods: formulating hypotheses, collecting data, analyzing data, and drawing conclusions based on evidence
processes: data collection, data preprocessing, data analysis, evaluation, and deployment
algorithms: clustering, classification, regression, machine learning, and more
systems: databases, cloud computing platforms, programming languages, and other software tools
to extract knowledge and insights from structured and unstructured data.
Environmental Data Science focuses specifically on applying data science techniques to study environmental systems and phenomena. It involves the collection, analysis, and interpretation of data related to the environment, such as climate data, air and water quality data, biodiversity data, and more. Environmental data science aims to understand and address environmental challenges by leveraging data-driven science and engineering.
Paradigms in science and engineering
Empirical description of nature
Theoretical with models and generalization
Computational with complex system simulations
Data driven science and engineering
2. Data-information-knowledge-wisdom hierarchy#
The Data-Information-Knowledge-Wisdom (DIKW) hierarchy is a pyramid with four levels, each representing a different stage in the transformation of data. Here is an example:

Data:
Description: Raw, unprocessed facts and figures without context.
Characteristics: Discrete, objective, quantitative.
Example: Satellite images, sensor readings of water quality, temperature measurements, species population counts.
Information:
Description: Data that has been given context and meaning, often by being organized or structured.
Characteristics: Processed, contextual, interpretable.
Example: deforestation rates, pollution levels in an urban lakes in low-income and high-income communities, trends in temperature changes over time, maps showing species distribution
Knowledge:
Description: Information that has been synthesized and understood, allowing for the drawing of conclusions.
Characteristics: Modeled, actionable, experiential.
Example : Understanding the impact of deforestation on local ecosystems, recognizing the correlation between urban lake pollution and public health, identifying the causes of climate change, understanding various drivers and species population dynamics.
Wisdom:
Description: The ability to make sound decisions based on knowledge, including a deep understanding of the consequences.
Characteristics: Decisional, reflective, moral.
Example: Implementing sustainable land management practices, developing an integrated project for urban lake restoration, developing policies for reducing carbon emissions, creating conservation strategies for endangered species.
2. Workflow#
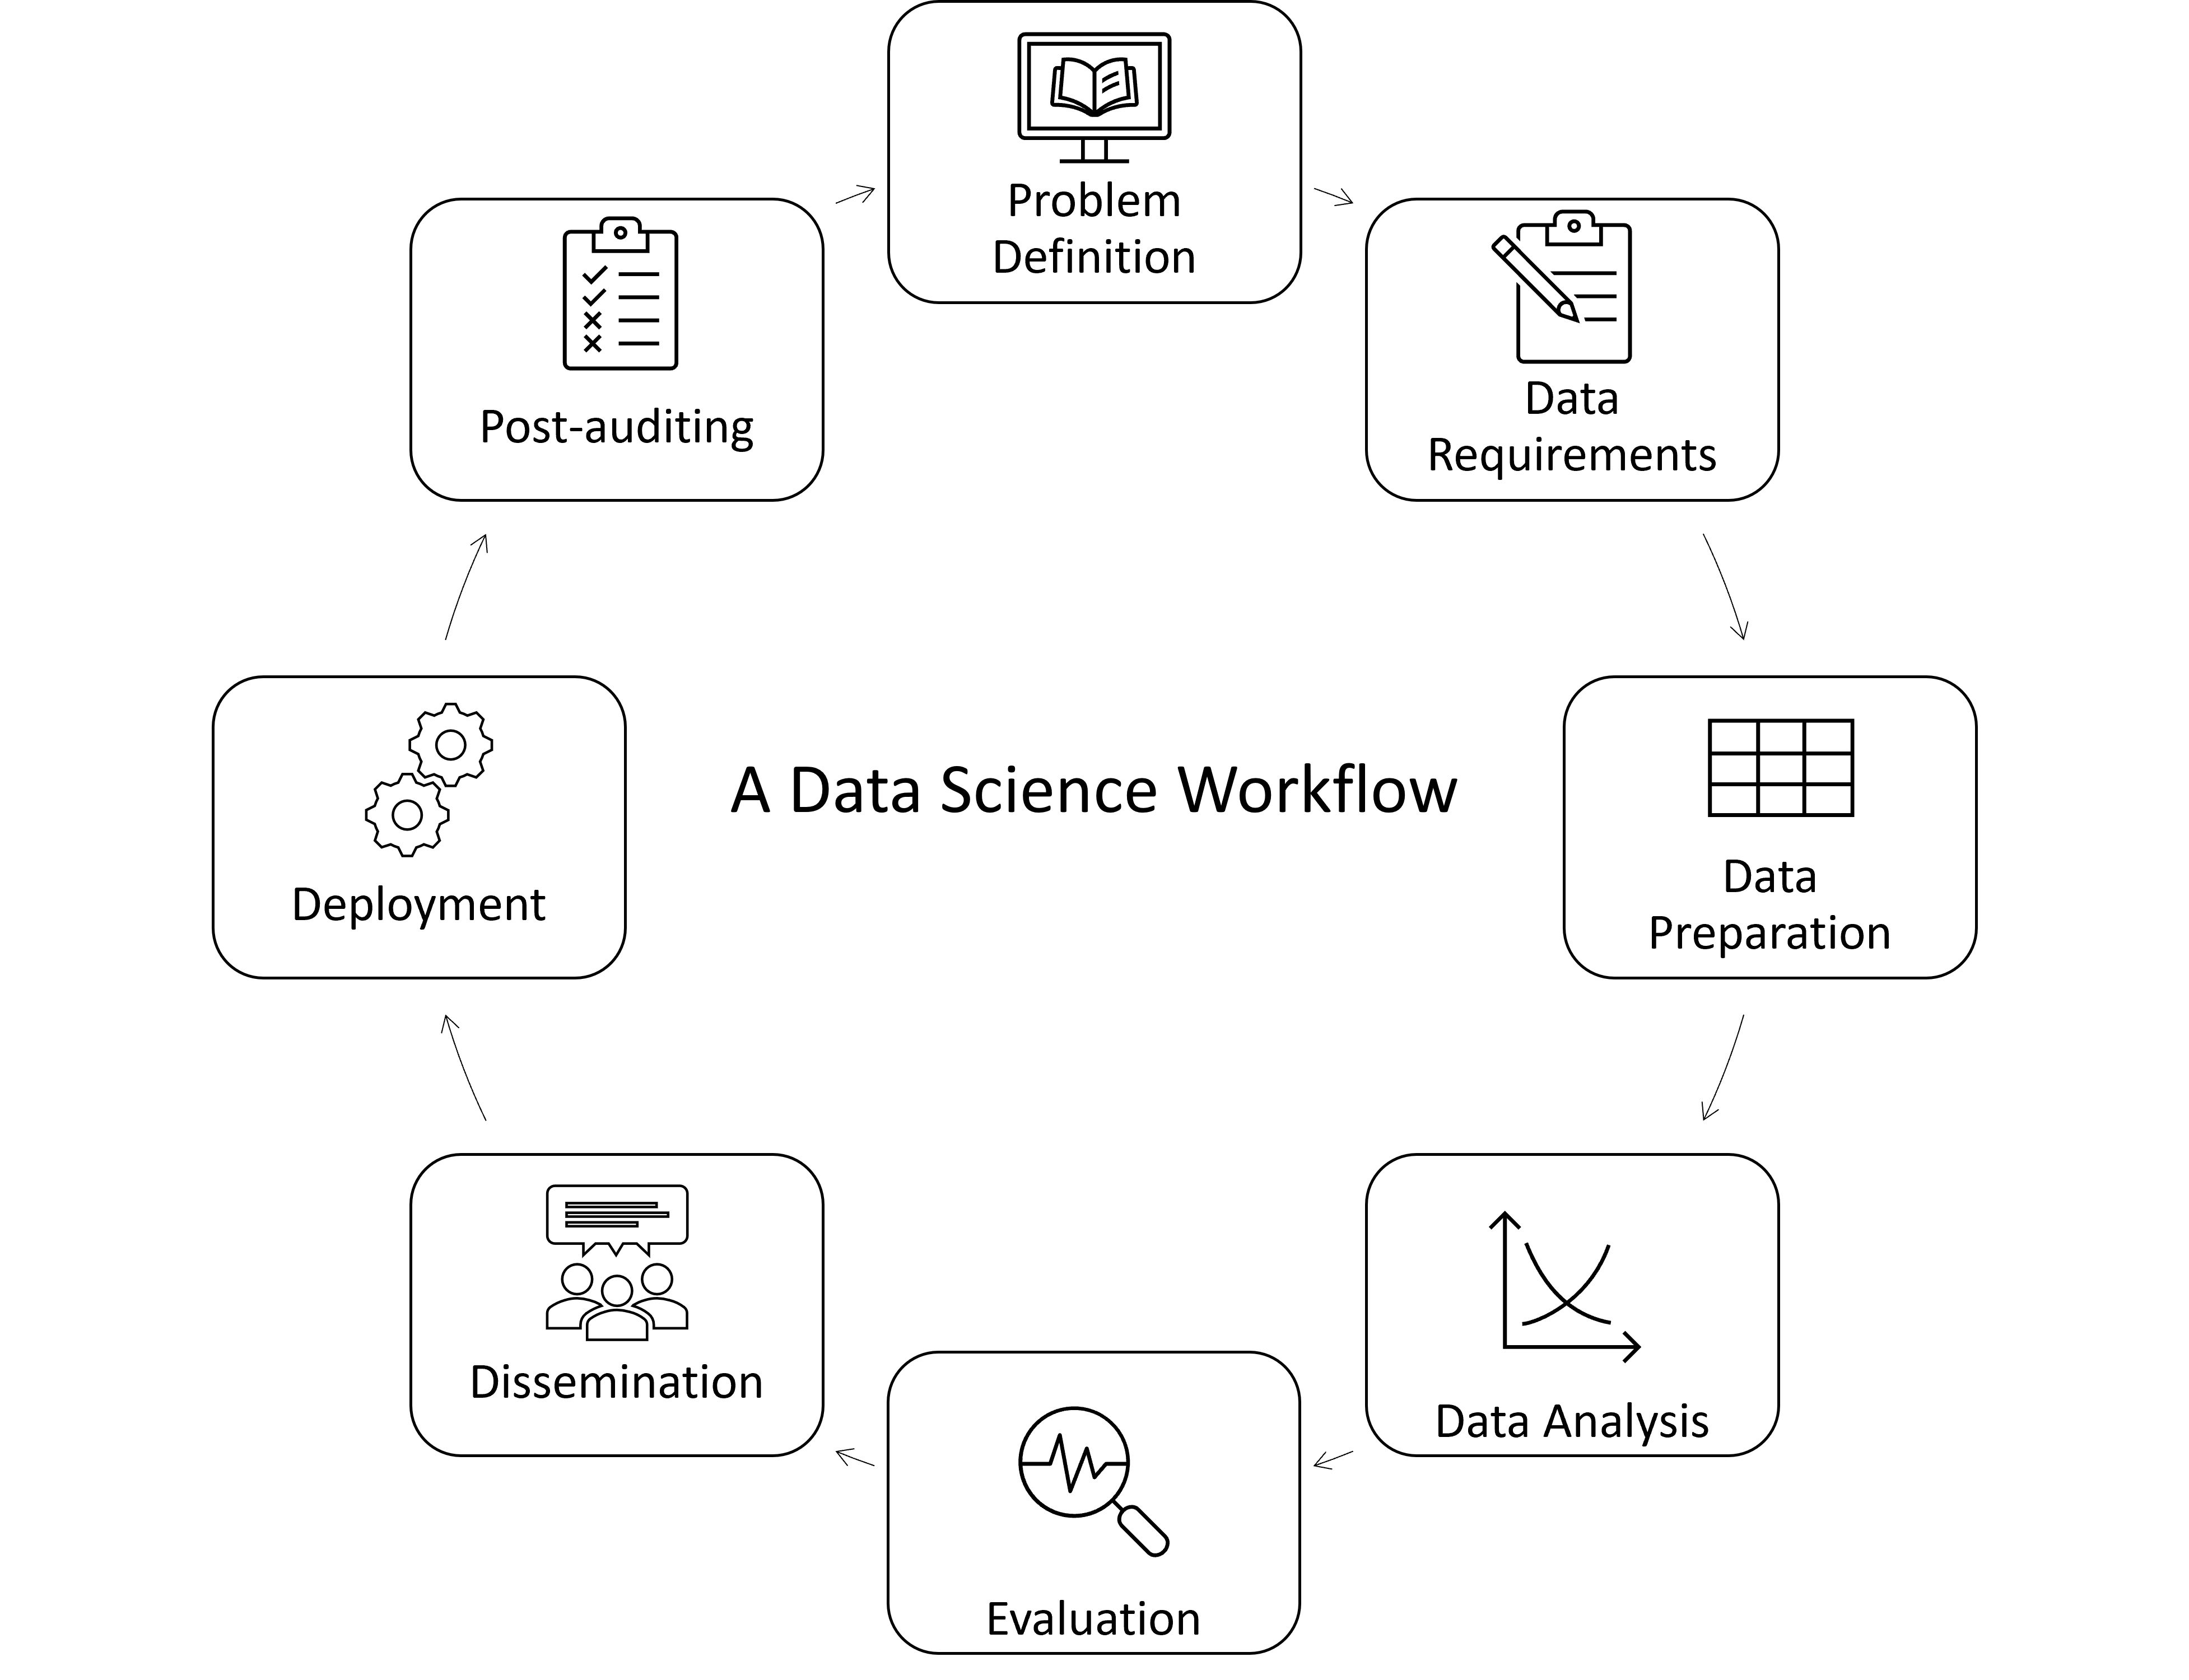
A data science workflow involves the process of collecting, preparing, analyzing, and interpreting data to extract valuable insights and make informed decisions.
Here is one workflow:

where:
Problem Definition: Identifying the problem to solve and defining objectives
Data Requirements: Determining what data is needed and available and how to obtain it
Data Preparation: Collecting and preparing raw data from various sources for analysis
Data Analysis: Extracting insights and patterns from the prepared data
Evaluation: Assessing the performance of models and analysis results
Dissemination: Communicating and sharing findings and results
Deployment: Implementing models or solutions in a real-world setting
Post-auditing: Conducting assessments after deployment to ensure continued effectiveness
2.1 Define problem#
Identifying the problem to solve and defining objectives
Understanding the research, management or business question
Defining the scope and objectives
Identifying key stakeholders
Exampe: What is the impact of COVID19 lockdown orders on air quality in Miami?
2.2 Data Requirements#
Determining what data is needed and available and how to obtain it, which includes
identifying data needed and its format
understanding the availability of the data
outlining the methods for obtaining such as surveys, experiments, or datasets
consider the quality and reliability of the data sources
This is an important steps the quality of your analysis depends on the quality of the collected data.
Example: We need to collect daily air quality data for parameters such as PM2.5, PM10, NO2, SO2, and CO in csv format from 2019 to 2021. That is one year before and one year after the lockdown orders of COVID 19. EPA Air Data contains air quality data collected at outdoor monitors across the US.
2.3 Prepare Data#
Data discovery and profiling: Exploring the content, quality, and structure of the dataset
Data collection: Gathering raw data from various sources for analysis
Data cleaning: Standardizing inconsistent data formats, correcting errors, and handling missing values
Data structuring: Organizing data for efficient storage and retrieval
Data enrichment: Enhancing dataset with additional information from external sources to improve analysis
Data transformation: Optimizing the content and structure of data for further analysis
Data validation: Ensuring the accuracy, completeness, and reliability of the data
Data integration: Combining data from multiple sources to create a unified dataset for analysis
2.3.1 Data discovery and profiling#
This step involves the process of exploring and understanding the characteristics and quality of your dataset. This step includes:
examine the data to gain insights into its structure, distribution, completeness, and quality
identifying the types of variables in the dataset
checking for missing values
assessing data quality issues including scrutinizing for inconsistencies, errors, outliers, or data entry mistakes that could impact the reliability of analyses
By the end of this step, you should be equipped with a comprehensive understanding of your dataset to make informed decisions regarding data collection, preprocessing and analysis strategies.
2.3.2 Data collection#
This is the process of gathering raw data from various sources:
Databases: Extracting data from structured databases like SQL databases or NoSQL databases such as MongoDB
Files: Reading data from various file formats like CSV, netCDF, shapefiles, JSON, images, or text files
Sensors: Collecting data from environmental sensors that monitor parameters like temperature, humidity, air quality, etc.
APIs: Fetching data from web APIs provided by organizations, government agencies, or environmental monitoring systems such as USGS, NOAA, NASA, CMIP, Google Earth enginer, and many more
Manual Data Entry: Inputting data manually when automated methods are not available or feasible
Python provides a rich ecosystem of libraries and tools that facilitate efficient data collection from various sources including
tools for making HTTP requests to APIs and fetching data with wide formats such csv, JSCON, XML, netCDF, images, shapefile, zip file, and many other such as
requestslibraries like
Geemapthat interact with the Google Earth Engine API for accessing and analyzing geospatial data on cloudtools like
beautifulsoupfor web scrapingtools for changing file formats and unzipping files such as
zipfilelibraries like
SQLAlchemyfor interacting with SQL databases andPyMongofor NoSQL databases like MongoDBlibraries for specialized file formats like netCDF and shapefiles such as libraries like
xarray,cartopy, andgeopandaslibraries like
sensorsorAdafruit CircuitPythoncan be employed to interface with sensors and capture data in real-timecapabilities for manual data entry through GUI libraries like
tkinterorPyQtcan be used to create interactive forms for manual data input within Python applications
By leveraging Python and its versatile libraries, engineers and scientists can streamline the data collection process across a wide array of sources.
2.3.3 Data cleaning#
This step involves identifying and correcting errors, inconsistencies, missing values, and outliers in the dataset. Common data cleaning tasks include:
Identifying and removing duplicate records from the dataset to ensure data integrity and avoid redundancy in analyses. Python provides functions like
drop_duplicates()in libraries such as pandas for efficiently handling duplicate data entries.Dealing with missing data points by either imputing them with a suitable value or removing them from the dataset. Libraries like pandas offer methods like
fillna()anddropna()to address missing values effectively.Ensuring consistency in data formats across different columns or variables in the dataset. Python allows for format standardization using functions like
str.lower(),str.upper(), or regular expressions to manipulate text data formats.Rectifying errors in data entries that may arise due to typographical mistakes, inconsistencies, or inaccuracies. Python’s string manipulation functions, data validation techniques, and outlier detection algorithms can aid in identifying and correcting data entry errors.
By performing these data cleaning tasks engineers and scientists can enhance the quality and reliability of the dataset.
2.3.4 Data structuring#
This steps involves organizing and formating the data in a way that is optimal for storage and retrieval. This step involves tasks such as:
restructuring data into a tidy format
combining datasets
reshaping data
creating new variables or features that may be needed for analysis
This step ensure that you can efficiently access your data for further analysis.
2.3.5 Data Enrichment#
Data enrichment is a process in which existing datasets are enhanced with additional information to make the data more valuable for analysis:
Incorporating external information such scientific understanding, engineering heuristics, demographic information, economic indicators, weather information, or any relevant external information that can provide context and deeper insights into the analysis
Creating new features or variables from existing data through transformation, aggregation, or combination
Calculating derived metrics or indicators that capture specific patterns, trends, or relationships within the data.
Data enrichment enriches the dataset with additional context, insights, and features to improve analysis.
2.3.6 Data Transformation#
Data transformation involves converting data into a format suitable for analysis. This step often includes tasks such as:
aggregation by combining multiple data points into a summary statistic
Filtering by selecting specific rows or subsets of data based on defined criteria or conditions
generating new variables or features from existing data
convert a Pandas DataFrame to numpy array for more advanced array operations. You can do this conversion using the method `.values.
Data enrichment and data transformation are closely related but distinct from data structuring. While data structuring primarily involves data wrangling for efficient storage and retrieval, data transformation focuses on preparing data for optimal analysis.
2.3.7 Data validation#
This ensures the data is accurate, complete, and consistent. Common techniques used in data validation include
statistical analysis
visualization
cross-referencing with known sources of truth.
This step ensures the integrity and reliability of the data for subsequent analysis.
2.3.8 Data Integration#
Data integration is the process of combining variables from different sources and formats into a unified view. Common challenges in data integration include dealing with
data inconsistencies
ensuring data quality
handling different data formats
resolving conflicts between datasets
By overcoming these challenges through robust data integration techniques is needed to reach a comprehensive dataset that include are your variables and is analysis ready.
2.4 Data Analysis#
Applying algorithms and statistical models to analyze the data
Data Exploration: Exploratory Data Analysis (EDA), statistical analysis, visualization
Feature Engineering: Creating new features from existing data, feature (variable) selection, dimensionality reduction (e.g., reducing the number of your variables)
Model Building: selecting algorithms, training models, hyperparameter tuning for machine learning
2.5 Evaluation#
Validating your data through techniques like
cross-validation
analyzing performance metrics
conducting error analysis
This is to ensure the accuracy and reliability of your findings
2.6 Dissemination#
Communicating your results and present your findings through
reports and presentations
embracing open science practices
onsidering other relevant factors in the dissemination of your research
2.7 Deployment#
Implementing the analytical model to solve the problem including
Integration into production environment and real world applications
Monitoring and maintenance
2.8 Post-auditing#
Model monitoring and updating including
performance monitoring
updating models with new data
iteration and continuous improvement